The Census - lives within numbers
 |
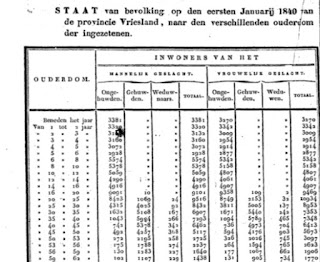
| Extract from the volkstelling of 1840 showing data for the province of Friesland. |
I'm researching my Dutch family history and in the Netherlands the word census translates to "volkstelling" - literally people count.
A google search brings up a site http://www.volkstellingen.nl/en/ so that is where I begin. This is now an archived site but the documents can still be read.
If you are tracing your Dutch family tree you won't get the kind of genealogical information you can get from the census in the US. I was already aware that the more detailed personal information comes from the civil registration registers, because I'd been accessing these from Amsterdam Stads Archief. For example the one below shows that Jan Peelen, his son Jan Hendrik Peelen and his wife Julia Wilhelmina Scherius, with their three children lived at 8 van Baerle Straat, Amsterdam in 1885.
 |
| From the Bevolkings Register Amsterdam showing occupants of 8 van Baerlestraat. |
To satisfy my curiosity I followed the links for the volkstellingen.nl and embarked on a different journey all together, an overview of Dutch social history.
The following are my observations from my admittedly not in depth scanning of the data presented in each of the "volkstellingen".
The first one is dated 1795. The Netherlands was known as the Bataafsche Republiek - Batavian Republic - and was under Napoleonic rule. It just shows population totals for presumably the main centres. The next one from 1830 again gives population totals for some towns in each province, but now broken down to males and females.
The 1840 volkstelling however, breaks it down to male, female, married, widowed, unmarried, and age. While I can't see any specific ancestor, because no names or addresses are given in this, some interesting detail for me comes out.
According to the data for the province of Vriesland (Friesland and a place of origin for our family), on 1st January 1840, for the age group 16-20 years of age there were 10 married men and 109 married women and 2 widows. Does this mean that the majority of married women had husbands working, living away from home at the time?
The next age group 20-25 sees a big jump in married men and women, but the age group with the biggest number of married men and women is 30-35 years.
Also I noted that at first the ages are grouped in five, but past the age 50, it is grouped in three years and after 65, the age is grouped in increments of 2 years. There was one hundred year old person, a man.
I haven't found any ancestors, but I have found a context for their life span and expectancy. Looking at the totals I can see that the greatest decline comes around the ages of 45-50.
The volkstelling of 1849 is even more detailed, giving the kind of residence - occupied, unoccupied, on a boat, on a boat and house. The boat residence interests me, because the Blombergs of that time were skippers on the river system. Also a breakdown according to religion, there is lots of variety there. There is also a breakdown according to place of birth - within the province, in other provinces, in other countries - Germany, Belgium, England (of these, German-born win).
The 1859 data is even more expanded - notably adding statistics for those separated or divorced and the deaf and blind. The term for separated is quite descriptive - "gescheiden van tafel en bed", meaning not sharing a table and bed.
The 1869 volkstelling intriguingly adds a category of "medicinal groups according to the state of the soil" - geneeskundige groepen naar de gesteldheid van de bodem. This category is missing though from the 1879 count. But exactly what it means I haven't worked out, yet.
A litte snapshot of information as I scanned the pdf text for 1879 was that a greater number of women than men migrated from the eastern provinces to the cities to take up work as maids and servants.
Also that families tended to be larger in the eastern provinces of Drenthe, than in the more centrally located Utrecht. I can see this reflected in my family tree.
The 1889 volkstelling adds categories for occupation and profession and adds the list of questions that had to be asked - 12 questions.
And for some reason, the results for 1899 are also translated in french! The dutch were ruled by the french under Napoleon from 1795 to 1815, but why now?
This year also adds a category for those living in wagens - wagons. The french phrase chariots nomades suggests gypsies. Hmm, more intrigue.
The french translation persists in the 1909 count and the breakdown for occupation or profession is even more detailed, giving 4 sub divisions A,B,C and D indicating directors/owners and managers down to workers.
It seems that the statistics were collected over a period of time 1919-1920. It is just a count of residential occupants in 1919 but in 1920 occupation and religion as well as the type of residences - houses, ships or wagons are detailed again.
The 1930 count is more detailed as to what kind of residence people lived in and also how many new and planned buildings, such as factories, churches, schools. It also gives a list of bodies of water larger than 75 hectares (there are three different names in the dutch language for this - meren, plassen en wateren)
The next one is in 1947 - longer than the previous 10 year cycles, because WWII intervened - and so this one should be really interesting, first peace time census again. The french translation has gone. There is a special map showing migration patterns within the country.
For the 1956 count there is a section detailing the state of housing supply - shortage, over supply, comparisons etc. A summary is also provided in english.
The next census was in 1960 and again a summary is given in english for each of the main sections. Aside from the usual statistics there are now also statistics for commuting to work, population density, degree of urbanisation. The housing statistics are very detailed, even detailing how many single persons, living alone or "op kamers" - boarding. Notable is also the measure for church affiliation - three categories: Roman Catholic, Reformed, or none. No longer is there a break down according to religion which in the 19th century statistics included details such as Mennonites, and Israelites and amounted to close to 12 different categories.
The census for 1971 is the last one listed on this site and it reflects increased social change. Many new categories are included; just a snapshot - time intervals between birth, ageing, the work/live balance, the different stages of families, women in the workplace and their family situation, social demographic analysis of marriages, educational achievement, the growth or decline of rural centres, the number of non-Dutch citizens, characteristics of marriage partners.
The 1971 data presents a more complex picture compared to the simple numbers presented in 1795. Much more diverse and multi layered. I see this also in my family history - the trend for moving away to the western, more urban centres, away from the rural provinces of Friesland, Groningen, Drenthe; the attraction of the colonies, the Dutch East Indies, migration to the USA; improved education as seen in the Blomberg skippers whose sons and grandsons become teachers, pharmacist, academics.


Comments
Post a Comment